ai-unsupervised-learning
Germán Salazar

Germán Salazar

Business Intelligence Consultant | Data Scientist

Other Articles:

AI: Unsupervised Learning

Share on linkedin
LinkedIn
Share on facebook
Facebook
Share on twitter
Twitter
Share on whatsapp
WhatsApp

Within the Machine Learning area, we can find several types of learning, including unsupervised learning. This area has a lot of potentials, as it saves us the tedious task of having a set of labeled data. Although most Machine Learning applications today are based on supervised learning, recognized experts in the field of AI, such as YannLeCun say that:

“If intelligence were a cake, unsupervised learning would be the cake, supervised learning would be the frosting, and reinforcement learning would be the cherry.”

The potential of unsupervised learning is yet to be exploited. Let’s look at the most common techniques and tasks of unsupervised learning:

– Clustering

– Anomaly detection

– Density estimation

Conclusions

Algorithms that we are going to see in this article:

> K-means

When using clustering algorithms our task will be to group similar (close) instances and separate these grouped instances from other different (distant) groups. Let’s take a closer look at the use cases mentioned above:

1. We can use clustering for market segmentation, in which we could segment our customers based on their purchases and their activity on the web. This brings us closer to the customer, giving us the possibility to adapt our products, services, or marketing campaigns to each segment.

2. If we have arecommendation systemwe could suggest content similar to the content that other users within the group are consuming.

3. In addition to being able to do data analysis of the groups formed or use a clustering algorithm to then analyze the groups separately.

4. We could use clustering as a dimensionality reduction technique. The advantage of this technique is that it can be applied at various points in the life cycle of an ML project (data exploration, modeling, fine-tuning). It will allow us to visualize groups and relationships between categorical variables, reduce computation time or obtain the most important features of our dataset.

5. Anomaly detection is another application that will allow us to see which instances have a low affinity with all groups, to detect outliers. It is useful to see which users have unusual behavior (speaking of behavior within the web), to see if there is any manufacturing defect, or to detect fraud.

6. If we have few tags within our dataset, we could perform a grouping and propagate the tags to all instances in the same group. This can be done within semi-supervised learning to later feed a supervised learning algorithm.

But it is not only useful for tabular data, within the world of images we can feed search engines that from a reference image show us other similar ones, this is done by applying grouping algorithms to the entire database of images and then return the images of the group to which the reference image belongs.

Finally, there is no universal definition of a group; different grouping algorithms will have different rules for creating groups and therefore different approaches in which they can be used.

K-means

K-Means is a simple algorithm that attempts to find the center of the groups it identifies while assigning each instance to the nearest group. In this case, what makes an instance to be added to a group is its distance to the nearest centroid.

Let’s see the setup for a code example:

K-means Code

We define the centers of our masses, their standard deviation, and the number of samples.

K-means Setup

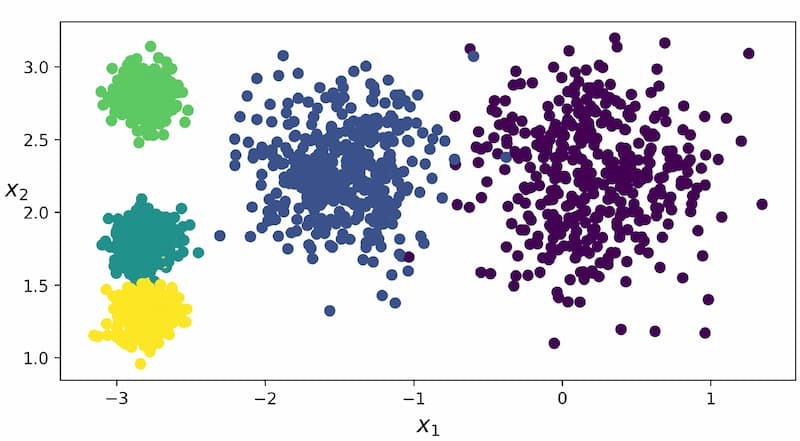
We graph our data.

K-means Data
Data Graphic

In this case, we see that it is easy to identify the groups, 5 in our case. This comes in handy since K-Means needs us to previously define the number of k groups it has to find, this can be a problem depending on the case, but there are techniques to try to define the number of k groups.

Now we are going to train the K-Means, what we are looking for is that each instance is assigned to each of the groups.

K-means Training

When we have defined the blobs, we have created a variable calledlabels, which may imply that we have labels for our data, but remember that we are talking about unsupervised learning and that we do not have labeled data here.

In this context, we refer to the label as the index of the group to which the algorithm assigns this instance.

We see the labels kept by K-Means.

K-means
K-means Labels

It can be read as instance 0 is at index 4, instance 1 is at index 1, and so on.

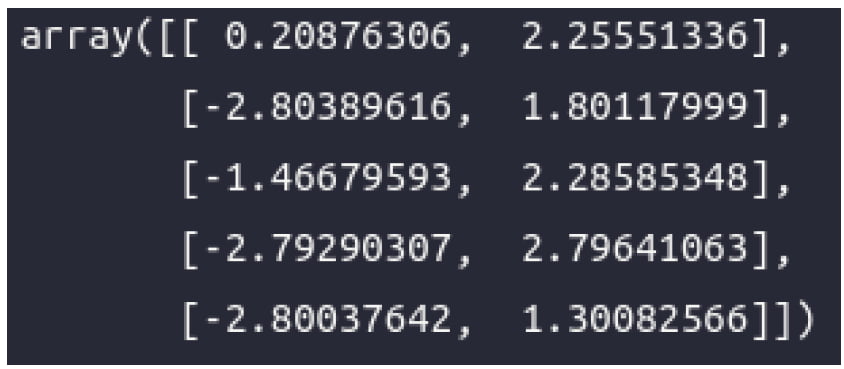
Let’s look at the 5 centroids it has found:

K-means Cluster
K-means Cluster Centers

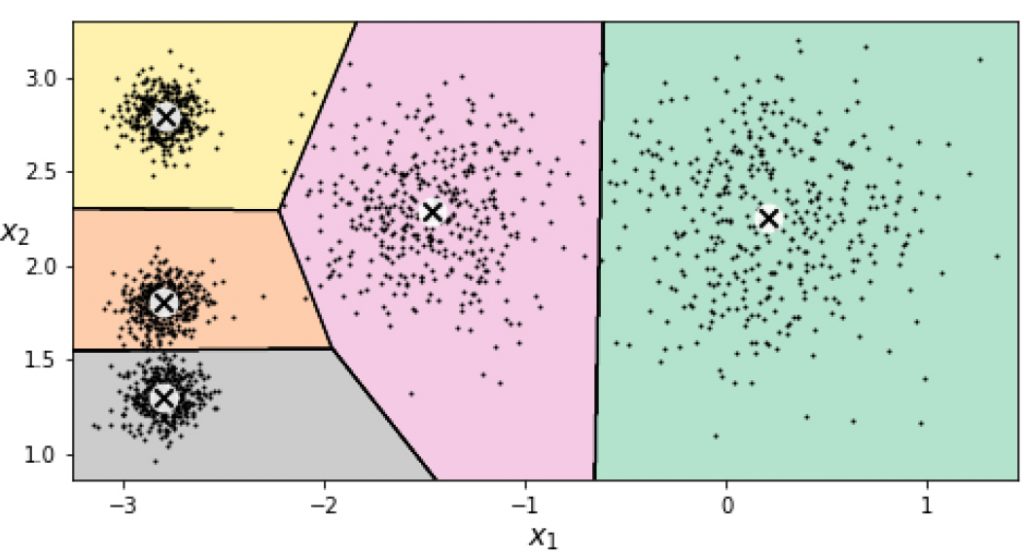
And finally, let’s see how K-Means has identified the centroids and delimited the area of each group.

K-means Graphic

This is a small sample of what clustering algorithms can do, this process could be extrapolated to the analysis of the behavior of our customers and see what groups we can identify.

In future articles, we will take a closer look at the inner workings of clustering algorithms and more advanced concepts.

Follow us on our social networks and for any comments, we are always available for all of you.

Deja un comentario

Your email address will not be published. Required fields are marked *

Business Data Master Logo

No te pierdas el

WEBINAR
Gratuito

Explicaremos en detalle los contenidos y objetivos del Business Data Master

29/11/2021

18:30 (GTM+1)

Online

BUSINESS DATA MASTER

* Tu información será utilizada exclusivamente para contactarte en relación al Business Data Master. No hacemos spam ni compartimos datos con terceros.