powerbi-paginated-reports

Other Articles:

Power BI Paginated Reports

Share on linkedin
LinkedIn
Share on facebook
Facebook
Share on twitter
Twitter
Share on whatsapp
WhatsApp

What are Power BI paginated reports?

Power BI paginated reports are a type of report specially designed for printing and sharing. As can be deduced from their name, they are so called because they are formatted to fit on a page. They are also known as pixel-perfect reports, which sounds much more grandiloquent: perfect down to the last detail.

Comparison between Power BI reports and Power BI paginated reports

An important advantage of paginated reports is the possibility to print all the data in a table, no matter how long it is.

If you try to print a page or table from your Power BI report, you will only see what you were viewing at the time of printing, preventing you from seeing rows hidden behind a scroll bar or on another page.

They are not as interactive as the reports developed in Power BI Desktop, nor do they pretend to be, their differential value lies in the fact that they can be printed and shared, and this is really useful when we want to share them with people or entities outside our organisation.

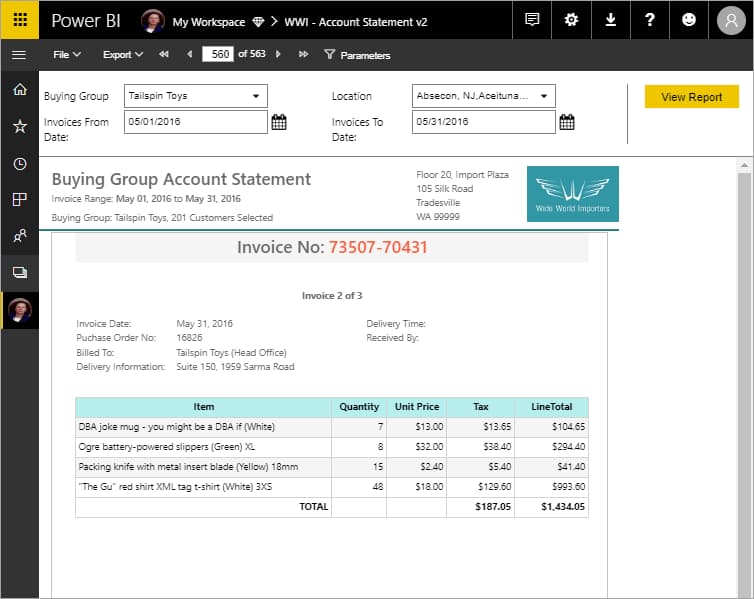
Due to their characteristics, Power BI paginated reports usually have many pages. For example, the following report is 563 pages long. Each of them precisely designed, with one page per invoice and repeating headers and footers.

Power BI paginated reports

Power BI Report Builder

These reports are developed using a separate tool called Power BI Report Builder.

It is a new tool that shares the same basis as previously existing tools for creating paginated reports for Power BI Report Server or SQL Server Reporting Services (SSRS).

In fact, the paginated reports you create for SSRS 2016 and 2017 or for Power BI Report Server in the local environment are compatible with the Power BI service. The Power BI service maintains backward compatibility, so you can move forward with reports, and you can upgrade any paginated report from a previous version.

The programme is free to download, but to publish and share paginated reports in your workspace or other areas, you need to be in a premium capacity and have write access to your workspace.

In a Premium Gen1 capacity, a Power BI administrator must enable paginated reports. Paginated reports are automatically enabled in a Premium Gen2 capacity.

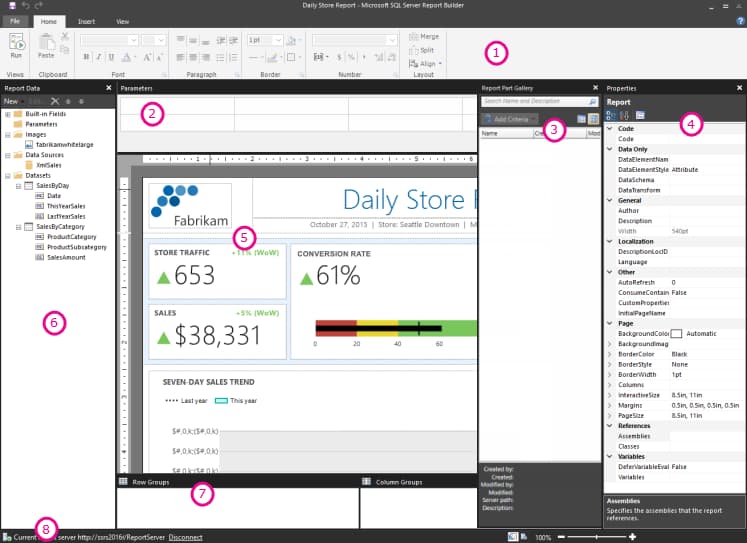
This is what the Power BI Report Builder interface looks like:

Report Builder
  1. Ribbon options
  2. Parameters Panel
  3. Gallery of report elements
  4. Properties, panel
  5. Report design surface
  6. Report data panel
  7. Grouping Panel
  8. Status bar of the current report

Report Builder vs. Reporting Services

As we have seen, paginated reports and the report builder are terms and tools that previously existed, free of charge (included with SQL Server), in Power BI Report Server or SQL Server Reporting Services (SSRS).

Despite being forgotten tools by Microsoft, the latter are still operational, so it is very interesting to see what differences and improvements, if any, Power BI Report Builder has over its predecessors.

The main difference lies in the working environment.

Power BI Report Builder is optimised to work with RDL Reports in Power BI Service, which is the cloud-based service or software as a service (SaaS).

In addition, it has the ability to log in to Power BI, allowing you to open and save reports from your workspace and also has support for querying both Power BI Premium datasets and Datasets that have been published to the service for non-premium users.

Being the newest and most cloud-focused, it is expected to receive updates and new features in the coming months.

On the other hand, SQL Server Reporting Services (SSRS) offers a set of local services and tools that allow, like Report Builder, to create, deploy and manage mobile and paginated reports.

It is focused on the production of so-called “traditional” paginated reports, but in practice its functions are practically identical for the time being.

For this reason, it seems difficult to make a case today for the extra cost of switching to Power BI Report Builder if you are already familiar and working with SSRS.

However, the future points to SaaS. Microsoft offers much more literature and tutorials for Report Builder development. So organisations that are not yet able, and willing, to produce paginated reports will probably prefer the convenience and user-friendliness of Power BI Service, especially, if there are already users uploading reports produced with Power BI Desktop.

Additional information

There is a tutorial on the Microsoft Power BI Youtube channel that provides some technical knowledge for using Report Builder.

There is even an online course.

For more information you can consult the Microsoft pages dedicated to the topic here or here.

Deja un comentario

Your email address will not be published. Required fields are marked *

Business Data Master Logo

No te pierdas el

WEBINAR
Gratuito

Explicaremos en detalle los contenidos y objetivos del Business Data Master

29/11/2021

18:30 (GTM+1)

Online

BUSINESS DATA MASTER

* Tu información será utilizada exclusivamente para contactarte en relación al Business Data Master. No hacemos spam ni compartimos datos con terceros.