MicroStrategy Grouping Methods
Joaquin Attanasio

Joaquin Attanasio

Business Intelligence Consultant | Microstrategy Expert | Data Specialist

Other Articles:

MicroStrategy Grouping Methods

Share on linkedin
LinkedIn
Share on facebook
Facebook
Share on twitter
Twitter
Share on whatsapp
WhatsApp

Hello everyone! How is it going? Welcome back, another week, to this magical and beautiful section of #BestInMicro!

This week I bring you an adventure of my colleague Juan Valladares. We received an incident from a user complaining about how long a report was taking to run. While many factors affect the performance of a report (I will write about them at some point), we found that in this particular case it was a problem with the design of the report itself.

MicroStrategy Loading

We noticed that the user wanted to analyze his result by grouping it into different categories, and for this, he had created a custom group with each of them.

Many of you will think… logical, isn’t it? Well, not so much. As I told you in the video explaining the different types of filters we have, there are different ways of grouping data in MicroStrategy, and depending on the scenario and needs, each of these ways will be appropriate.

As always, let’s start at the beginning…

How much can the data be grouped?

Data grouping in MicroStrategy allows us to generate a set based on different conditions. For example, group months into seasons, zones into regions, or different categories at ….. well, more general categories.

The groupings are not only tied to a particular attribute but, given the situation, we may want a group that results from a combination of different filters, attributes, and conditions (for example, users from Argentina aged 18 to 24).

MicroStrategy Grouping Types

Therefore, there are three different ways of grouping information in MicroStrategy. Let’s take a look at each of them.

Derived Elements

MicroStrategy Grouping Methods

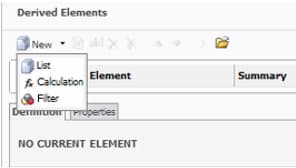
Perhaps a simple way to understand derived elements is to think of a derived metric. That is, we take an indicator and use it to make a new indicator by taking the original and applying some operation to it, be it a filter, a sum, or some other formula. With derived elements, we can create sets with our attributes, either by selecting several and grouping them, generating some calculation between them, or applying some condition. A derived element allows us to group on the basis of:

– List of elements

– Calculations

– Filters

Grouping Methods Derived Elements

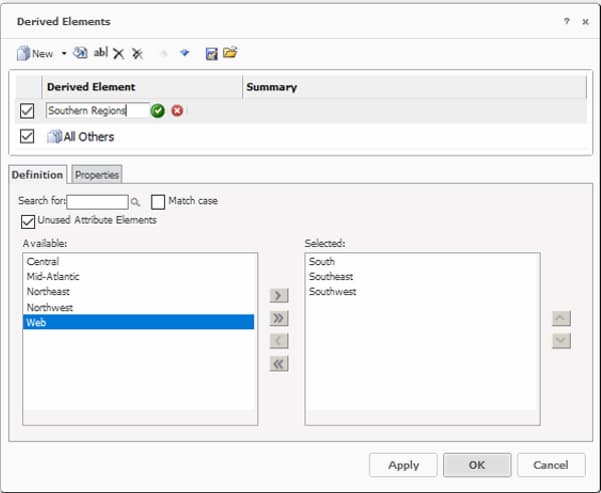
For example, we create a group that is “East Zone” and generate a list of regions that are in the east zone.

Microstrategy Web Grouping Methods

Derived elements are available only from MicroStrategy web. That is, we will not be able to create these elements using the Developer.

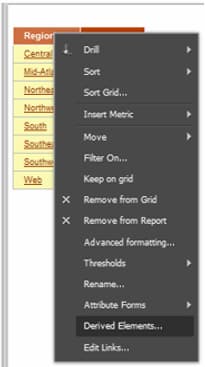
A simple way to create a derived element is to right-click on the attribute and select “derived elements”, or simply, with the report running, select the values you are interested in grouping and right-click- > Create group. Ready!

Grouping Methods Derived Element Image

Consolidation

Grouping Methods Image

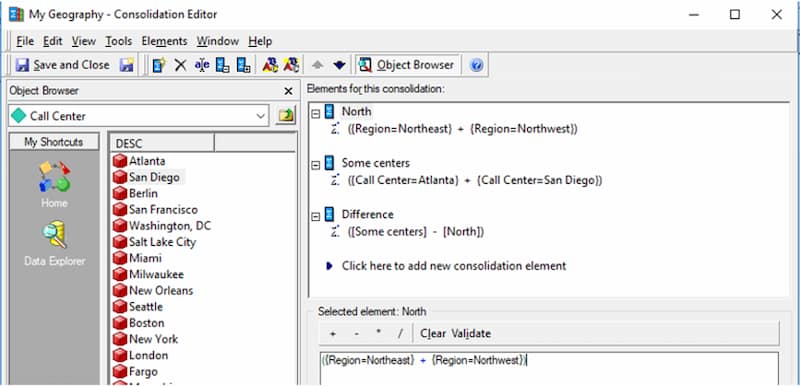
Consolidations are a combination of values of one or more attributes that can be combined to generate a group. We can create groupings with:

Elements of the same attribute, such as two cities.

Attributes of different levels of the same hierarchy, such as Region and Province.

Attribute elements from different hierarchies, such as Country (from the Geography hierarchy) and Year (from the Time hierarchy).

Existing consolidation elements, such as the relationship between spring and summer sales and fall and winter sales.

Elements of any other consolidation in the project (elements imported from one existing consolidation to another).

Grouping Methods Consolidation Editor

Unlike derived elements, consolidations can be created only in the Developer, and their creation is quite simple as well. We simply define the groupings we are interested in combining and we can use it as another attribute.

Customized Groups

Grouping Methods Custom Groups

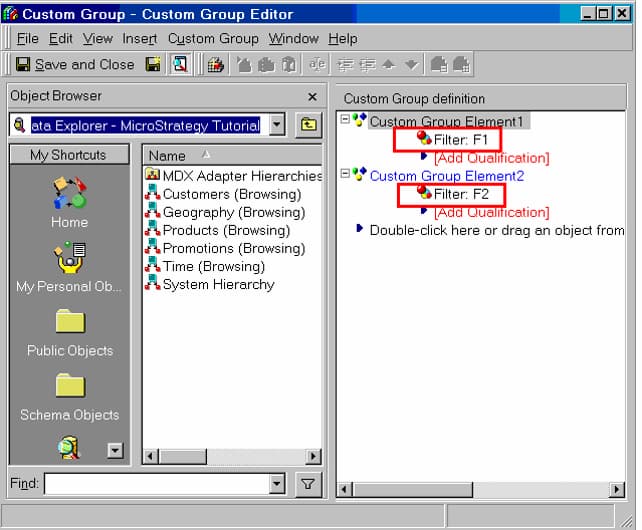
These allow grouping elements of one or different attributes, filters, and/or conditions to create the group we are interested in generating in our reports.

A customized group is composed of different groups. Each of these groups can have conditions that are totally independent of each other, which allows the generation of totally customized groupings.

The big difference with a customized group is that it has a direct influence when generating the query, so it has a direct impact on performance. If different groups with different conditions are created, the query will have high complexity, with several steps, and may end up resulting in a report that takes hours or even days to resolve.

Grouping Methods Custom Groups Editor

On the other hand, if you understand how to set up a customized group, the performance may end up being better than using the other methods, in addition to giving you a great deal of flexibility in defining the grouping conditions.

Another great advantage of customized groups is the range of options they offer. Customization can be generated at the level of each group, e.g. presentation of totals and sorting. If you are interested, I can go into detail later and write an article just about custom groups to analyze these aspects.

Conclusions

As mentioned above, it depends on each scenario when it is appropriate to use each type of grouping. In the derived elements and consolidations, the calculations are made at an analytical level, that is, they are performed in memory by the Intelligence server, which gives us a better performance when representing the information, but it also has certain limitations and can even end up being counterproductive depending on the complexity of the group. Here is a comparison chart so that you can choose for yourselves which one to use.

Grouping Methods Board

I hope you found it interesting and that it will help you to continue improving your reporting.

See you next time!

References

One Response

  1. This is perfect! I was thinking while reading that I’ll create a summary table for all 3 methods but it was already there in the end. Thanks a lot for this.

Deja un comentario

Your email address will not be published. Required fields are marked *

Business Data Master Logo

No te pierdas el

WEBINAR
Gratuito

Explicaremos en detalle los contenidos y objetivos del Business Data Master

29/11/2021

18:30 (GTM+1)

Online

BUSINESS DATA MASTER

* Tu información será utilizada exclusivamente para contactarte en relación al Business Data Master. No hacemos spam ni compartimos datos con terceros.