powerbi-project-management
Leticia Cristobal

Leticia Cristobal

BI Consultant | Data Analyst | Experiencia internacional

Other Articles:

PowerBI: Project Management

Share on linkedin
LinkedIn
Share on facebook
Facebook
Share on twitter
Twitter
Share on whatsapp
WhatsApp

The use of BI tools is widespread in all areas as they are a great help for data-driven decision-making.

The data from the different sources, once integrated and processed, are visually presented in an aggregated form from different perspectives, which allows a much more effective analysis.

The possibilities for using BI are endless, depending on the company and the objectives pursued. There are numerous BI tools available, today we will focus on Microsoft’s Power BI.

For project management, using this type of tool offers many advantages:

  • It allows you to quickly monitor the status of your project portfolio while being able to interact to access the level of detail you require.
  • They offer a high degree of customization to suit all needs.
  • Information from various sources can be integrated into one place and connected (scheduling, costing, risk analysis, etc.).
  • The distribution of information to the different stakeholders is very simple with the publication of reports, being able to choose the level of access to be given to each group of users.

Overview of the entire portfolio at a glance

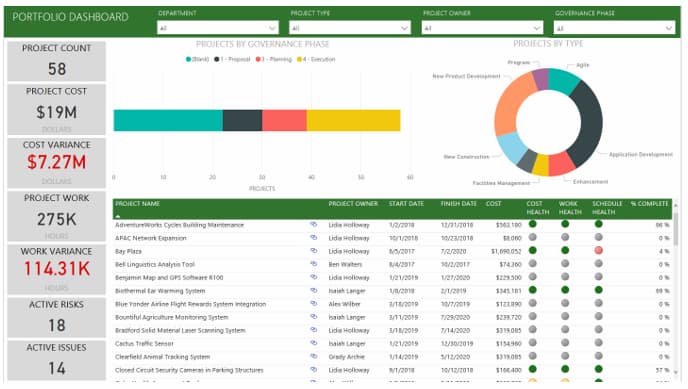
In the field of project management, BI allows us to monitor the critical aspects of our projects, being able to analyze the overall health of our portfolio at a glance.

Are our projects meeting cost, schedule, and scope forecasts? How many active risks are there at the moment?

In a single panel, we can show different global indicators on the health areas of our projects (cost, scope, schedule, risks, incidents…). If we detect problems or deviations from the forecasts we can, at the click of a button, filter the information and drill down to more detailed levels.

dashboard-power-bi-project-management

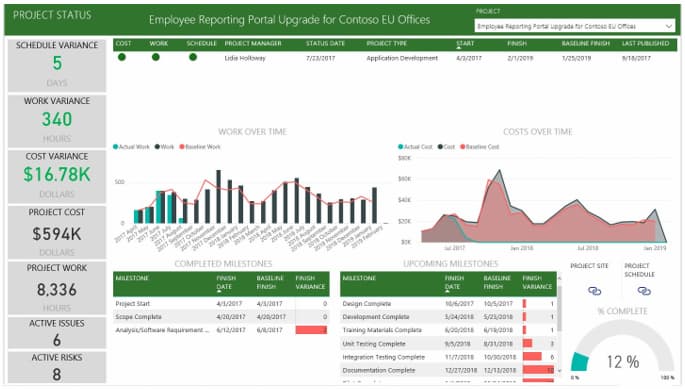
If the dashboard shows for example some variation in a project deadline, we can select that particular project and see where the delay is occurring in order to take corrective action.

project-status-power-bi-project-mansagement

Highly customizable

These reports can be customized, both in terms of types of visualizations and formats, to suit the needs of different projects and end-users.

The most common general visualizations such as bar charts, line graphs, matrices, etc., allow the construction of the most common indicators and graphs that we will need.

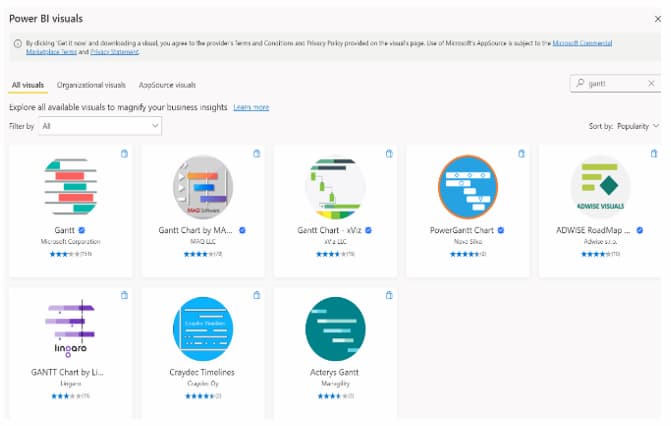
However, Power BI has many more specialized visualizations, such as a Gantt chart, timeline, or risk matrix.

power-bi-visuals-project-management

There is even the option to include graphics created with R or Python if appropriate.

In terms of formatting, Power BI also offers many options to adapt the dashboards in terms of colors, the inclusion of titles, images, icons, etc. that help the information to be transmitted more efficiently, and adapted to end-user use.

Integration of data from different sources

Another advantage of this tool is the possibility of connecting to different data sources and combining information from different sources such as excel files, CSV, Oracle or Microsoft SQL Server databases, etc…

It is common for the information needed to monitor the status of the project to come from different sources. For example, the work program may come from Primavera or Microsoft Project, while the costs may come from Presto, SAP, Access, etc.

For most of the data sources, there are specific connectors for the direct import of data into Power BI.

In the specific case of Microsoft Project, Power BI allows you to connect to both Project Online and Project for the web, with a series of pre-designed dashboard templates.

Once imported to Power BI all this information can be connected to analyze it together, greatly facilitating the work of monitoring and control.

Communication facility

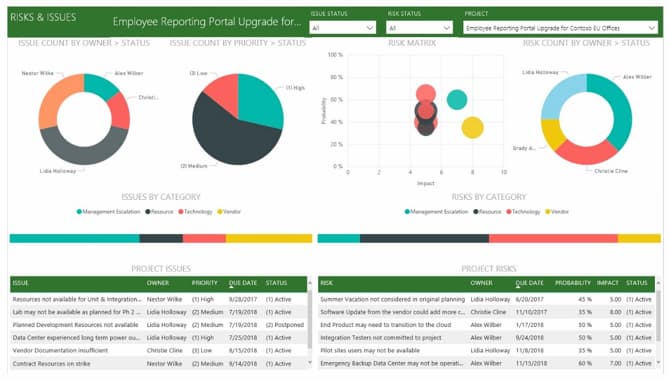
A project manager spends much of his or her time monitoring project status and communicating. Communication to the various stakeholders is much easier using this type of tool as reports can be published for access via the web or mobile devices. You do not need to be a BI expert to view and interact with these dashboards.

Another interesting point is that we can set different levels of access to control what information we share with whom.

power-bi-project-management-dashboard-example

SUMMARY

In summary, the use of BI tools facilitates the work of project managers by integrating into a single place all the information relevant to the status of our project or portfolio, providing an overview while allowing interactive deepening to perform more comprehensive analysis when necessary. It is also very useful for distributing the information to the different stakeholders who will be able to access the updated information via web or mobile devices, according to their level of access.

Deja un comentario

Your email address will not be published. Required fields are marked *

Business Data Master Logo

No te pierdas el

WEBINAR
Gratuito

Explicaremos en detalle los contenidos y objetivos del Business Data Master

29/11/2021

18:30 (GTM+1)

Online

BUSINESS DATA MASTER

* Tu información será utilizada exclusivamente para contactarte en relación al Business Data Master. No hacemos spam ni compartimos datos con terceros.